
TL;DR: You can’t scale or turn a profit if you can’t connect your marketing spend to paying members. We cover how to calculate gym marketing ROI, the metrics that matter, and how to build a marketing dashboard that replaces the spreadsheet for good.
You’re running Instagram ads. You have a referral program. Your Google ad campaigns are spot-on. Members are coming in, but when inquiries come about which channel is actually producing them, you’re left guessing.
Most gym owners and managers track marketing the same way: a spreadsheet, a gut feeling, or both. However, neither method tells you which dollars turned into members last month and which just disappeared into the algorithm.
This piece is about fixing that. We’ll walk through the gym marketing ROI formula, the metrics that connect spend to revenue, and how to build a gym analytics dashboard that replaces clunky spreadsheets.
Why Gym Marketing ROI Is Harder to Track Than It Looks
Most gym owners know what they’re spending on marketing. However, far fewer know what that spend is returning. That gap is a direct opportunity to increase revenue without increasing budget.
The instinct is to track what’s easy: follower counts, post impressions, and ad clicks. These numbers are visible and satisfying to watch go up. They’re also almost entirely disconnected from revenue. A campaign that generates 10,000 impressions and zero new members has a marketing ROI of exactly zero.
The harder (and more important) question is attribution: which touchpoint gets credit when a new member signs up?
The spreadsheet problem
Unfortunately, things break down quickly with manual tracking. Lead data lives in your CRM. Ad data lives in Meta or Google. Membership revenue lives in your gym management platform.
By the time someone exports each source and builds a comparison, the information is two weeks old and the next campaign is already running.
The result is budget decisions made on nothing but feel. Operators double down on channels that look busy rather than channels that actually convert.
Why channel attribution matters
Attribution means knowing where a lead came from (paid social, a referral, a Google search, a community event, etc.) and whether that lead became a paying member. Even basic first-touch attribution is dramatically more useful than none.
Without detailed gym marketing analytics, you have no basis for reallocating your budget. By consistently tracking the right metrics, you can see that referrals convert at twice the rate of paid social (for instance) and adjust accordingly. This is the difference between scaling profitably and spending more to stay in the same place.
📝 Read More: Gym Lead Management: How to Capture & Convert More Leads

The Gym Marketing ROI Formula
Before diving into channel-level gym marketing analytics, every operator needs one foundational number: their overall gym marketing ROI.
A basic marketing ROI formula
Gym Marketing ROI = (Revenue from Marketing − Marketing Costs) ÷ Marketing Costs × 100
For instance: If you spend $2,000 on paid social and the members acquired through that campaign generate $8,000 in new membership revenue, your ROI is 300%.
Typical marketing costs include ad spend, campaign management software, staff time on marketing activities, and promotional materials. Capturing all of it gives you a number you can actually use to make better business decisions.
A 3:1 ratio (300% ROI, or $3 in revenue for every $1 spent) is a common starting benchmark for healthy gym marketing performance. However, it’s best to treat this ratio as a reference point rather than a fixed target; the ideal ratio varies by business model, channel mix, and average membership value.
Cost per lead and cost per member
Cost Per Lead (CPL) = Total Channel Spend ÷ Leads Generated
Customer Acquisition Cost (CAC) = Total Channel Spend ÷ New Members Acquired
CPL tells you how efficiently a channel generates interest. CAC tells you whether that interest converts to revenue. A low CPL with a high CAC means leads aren’t closing, which is a sales or offer problem, not a marketing one.
On lifetime value: if your average member pays $60/month and stays 10 months, their LTV is $600. Your CAC needs to sit comfortably below that number for the channel to be profitable. Two-Brain Business suggests healthy CAC typically runs well below $300 for retention-focused businesses.
📝 Read More: The Gym Sales Funnel: From Lead to Loyal Member

The Metrics That Actually Show Which Channels Are Working
ROI formulas tell you whether or not a channel is profitable. The metrics below tell you why, and where the leaks are. These are the gym marketing analytics to focus on.
Lead source tracking
Every lead that enters your pipeline should have a tagged source: paid social, Google, referral, organic search, community event, or walk-in. Without this, you can’t break your gym marketing analytics down by channel, which makes it tough to reallocate budget properly.
ABC Glofox and ABC XLerate let operators track lead sources centrally and report on lead and conversion performance without stitching everything together manually.
The result? You get channel-level data when you need it without having to spend hours hunched over a computer.
📝 Read More: The Ultimate Guide to Gym Lead Generation
The lead → trial → member funnel
It’s important to track the full journey in three stages:
Lead (contact captured) → Trial (free class or intro session booked) → Member (membership sold)
Measure the conversion rate at each transition. Where the drop-off happens tells you where to intervene. For instance, high leads with a low trial rate points to a follow-up problem. Whereas a high trial rate with a low member rate points to a sales or offer problem. These require different fixes.
📝 Read More: Save Time and Money: How ABC Glofox Replaces 5 Tools with One Platform
Channel comparison: where fitness operators typically see the strongest ROI
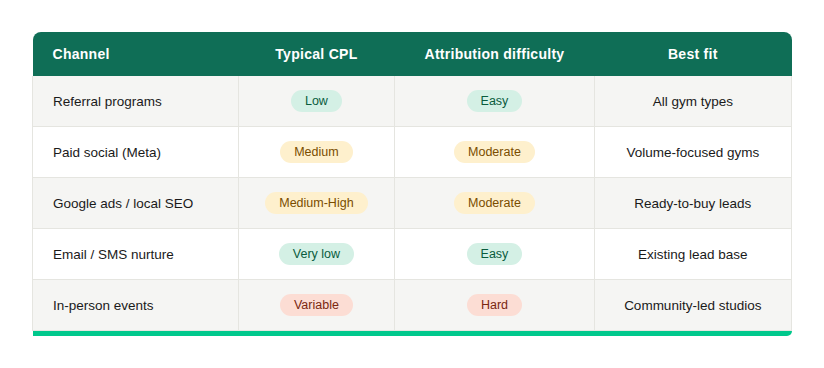
Referrals produce the lowest CAC and highest member LTV; the lead arrives with trust already established. According to Hubspot, email and SMS cost almost nothing per contact once the lead base is in your CRM. Paid social drives volume but attribution is harder and conversion rates are typically lower.
Operators running paid ads should use UTM parameters to tag campaign traffic in Google Analytics. This shows you how people are finding your website; it’s your gym management platform where you’ll see whether those visitors actually became members.
📝 Read More: 20 Evergreen Marketing Strategies for Gyms
How to Build a Gym Marketing Dashboard (Without a Spreadsheet)
The goal of a gym marketing analytics dashboard is simple: one connected view of lead sources, conversions, and business performance without relying on manual exports
What a useful gym analytics dashboard should show
Six numbers tell most of the story:
- Active leads by source: Where are new leads coming from this month?
- Lead-to-trial conversion rate by channel: Which sources are booking?
- Trial-to-member conversion rate: Which trials are closing?
- Cost per lead by campaign: For paid channels with UTM tracking
- Revenue from new members by month: Trended over time
- At-risk member count: Retention signal that feeds back into gym marketing ROI
That last metric matters more than it might seem. If members acquired through paid social are churning at 60 days while referral members are still active at 12 months, your paid social ROI is significantly worse than the headline numbers suggest.
Retention data and acquisition data need to live in a single 360-degree view of your gym marketing analytics in order to tell the full story.
“ABC Glofox puts everything in one place and definitely helps generate revenue.” – Brandon Cala, Eternal Fitness
How ABC Glofox connects the dots
At ABC Glofox, our dashboard brings lead data, booking activity, membership revenue, and engagement signals together in one place. (Nobody has time to cross-reference multiple platforms to answer a single gym marketing analytics question!)
Our CRM, ABC XLerate, tracks lead sources centrally and organizes conversion data by channel. Operators can track lead sources, conversion performance, and revenue trends in one connected system, making it easier to see which channels are contributing to growth.
Looking to add a retention layer on top of your existing gym analytics? Our AI Churn Predictor flags at-risk members, helping operators spot early disengagement and act sooner to improve retention.
The answer to “which campaign paid for itself?” shouldn’t require a spreadsheet. With ABC Glofox, it doesn’t.
📝 Read More: How ABC Glofox’s AI Can Mitigate Member Churn and Boost Retention

FAQs: Gym Marketing ROI and Analytics
What is the ROI of a gym business?
Gym marketing ROI measures revenue generated by marketing activity relative to what was spent. The formula: (Revenue from Marketing − Marketing Costs) ÷ Marketing Costs × 100. A 3:1 return (300%) is a common starting benchmark ($3 in new membership revenue for every $1 in spend).
What is a good ROI percentage in marketing?
When it comes to gym marketing analytics, 300% (3:1) is a widely cited baseline. Referral programs typically outperform this benchmark because CAC is low and referred members tend to stay longer. Paid social often underperforms it when attribution is tracked accurately and early churn is factored in.
How do gym owners measure marketing ROI without spreadsheets?
By connecting lead source data, conversion tracking, and membership revenue inside a single platform. Our ABC Glofox CRM and reporting tools track the full journey from lead source to paying member, so channel-level ROI is visible without manual data work.
How do I know which marketing channel is bringing in paying gym members?
Lead source tagging is foundational: every lead gets an assigned source. From there, tracking lead-to-trial and trial-to-member conversion rates by source shows which channels generate members, not just leads. That’s the main number that matters for gym marketing analytics.
Track Gym Marketing ROI and Grow Smarter with ABC Glofox
Gym operators who properly measure their gym marketing analytics can stop wondering where to put their budget and start scaling the channels that work. The ones who don’t will continue to spend on a hunch and scratch their heads when growth flatlines.
You can’t scale what you can’t see. With ABC Glofox, lead, booking, membership, and reporting data live in one connected platform.
Book a free demo to see how ABC Glofox’s reporting tools connect your marketing spend to increased memberships.